GTM Tag Fires in Preview but Events Don’t Show in GA4: 12 Checks That Fix It
By Humayun Kabir Naim — 5 November 2026
Quick answer
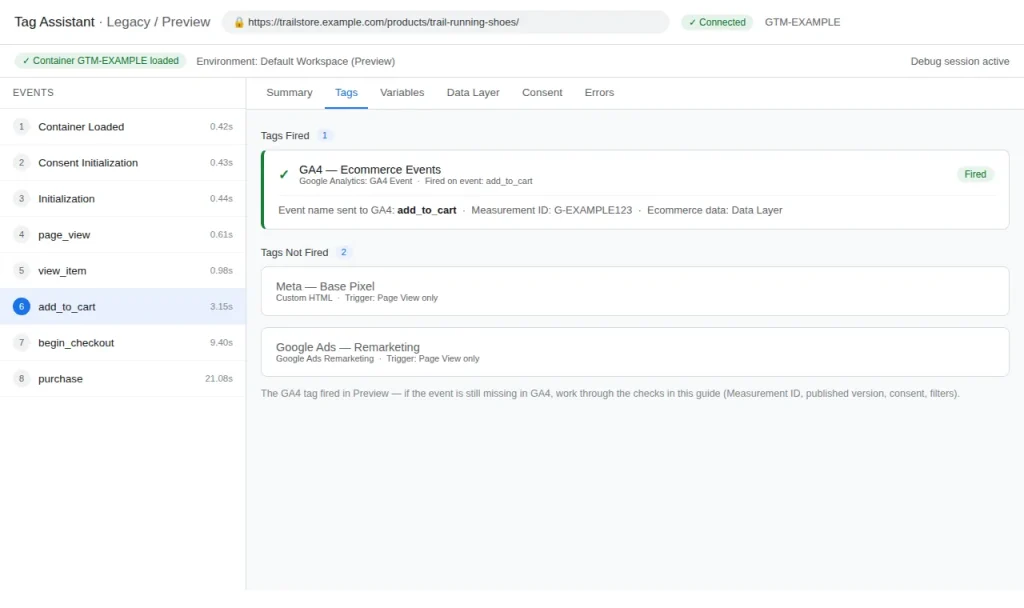
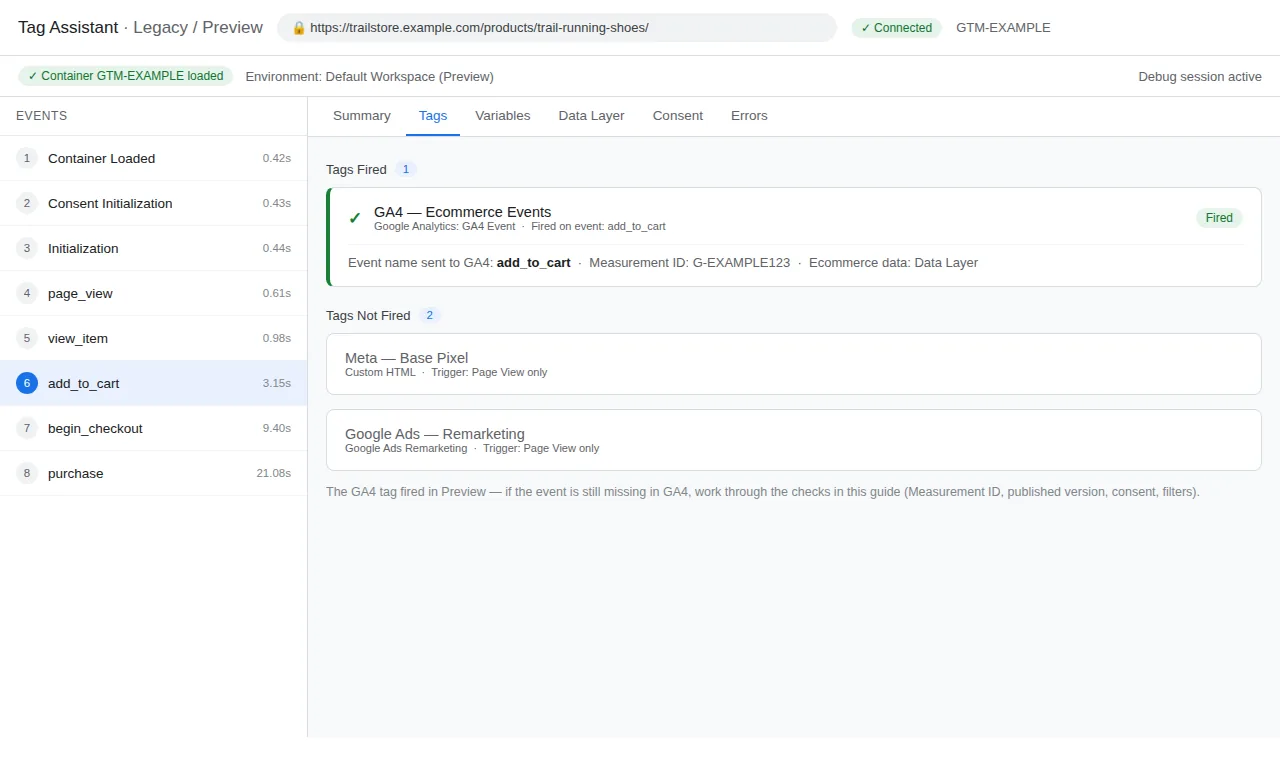
If a tag fires in GTM Preview but the event never shows in GA4, the tag is rarely the problem. In most cases the hit goes to the wrong Measurement ID, the container was never published, consent blocks the hit, a GA4 filter hides your own test traffic, or you are checking the wrong report too soon. The 12 checks below run in that order.
If a tag fires in Google Tag Manager Preview but the event never appears in Google Analytics 4, the tag is rarely the problem. In most cases the hit is going to the wrong property, the live container was never published, consent is blocking it, a GA4 filter is excluding your test traffic, or you are looking in the wrong report at the wrong time. Work through the checks below in order — they go from the most common and easiest to spot, to the ones most people miss.
That ordering matters. I have seen people rebuild a whole container because an event was ‘missing,’ when the real cause was an internal traffic filter hiding their own IP address.
Quick diagnostic: where does the hit stop?
| What you see | Most likely cause | Go to |
|---|---|---|
| Tag fires in Preview, nothing in DebugView | Wrong Measurement ID, consent blocked, or ad blocker | Checks 1, 4, 7 |
| Works in Preview, fails on the live site | Container not published, or wrong environment | Checks 2, 3 |
| Event is in DebugView, not in Realtime | Normal delay or a filter/threshold issue | Checks 5, 6, 11 |
| Event reaches GA4 but has no useful data | Wrong event name or parameters | Check 9 |
| Event fires twice or looks inflated | Hardcoded gtag.js running alongside GTM | Check 8 |
| Event worked yesterday, stopped today | A publish, theme update, or consent change | Checks 2, 4, 10 |
Check 1: The Measurement ID does not match
Symptom: The GA4 tag fires cleanly in Preview, with no errors, but DebugView stays empty.
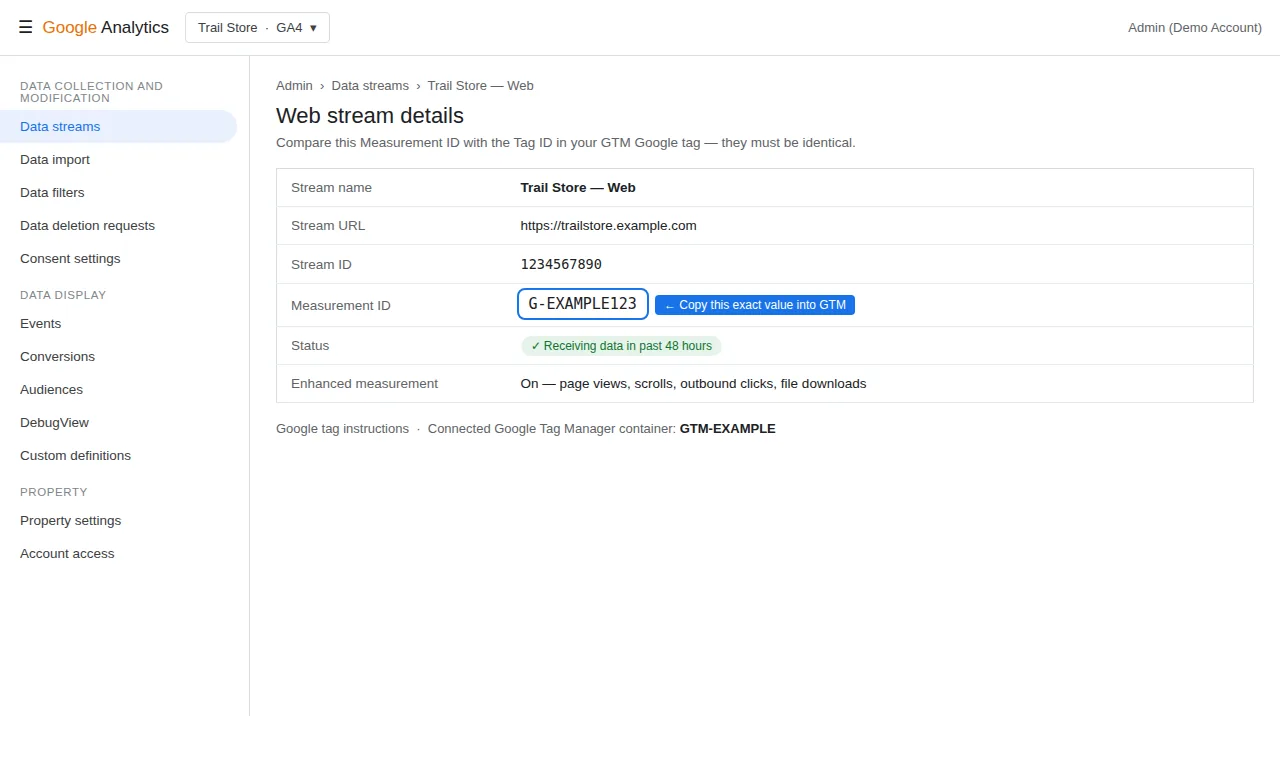
Verify: In GTM, open your Google tag (or GA4 event tag) and copy the Measurement ID. Then go to GA4 > Admin > Data streams > your web stream and compare it, character by character. Next, in GTM Preview, click the fired tag and check the ID shown in the outgoing hit.
Fix: Correct the ID in one place only — ideally a GTM constant variable every GA4 tag uses. This catches a common case: a container copied from another site, or a staging ID left behind, sending data to a property nobody checks.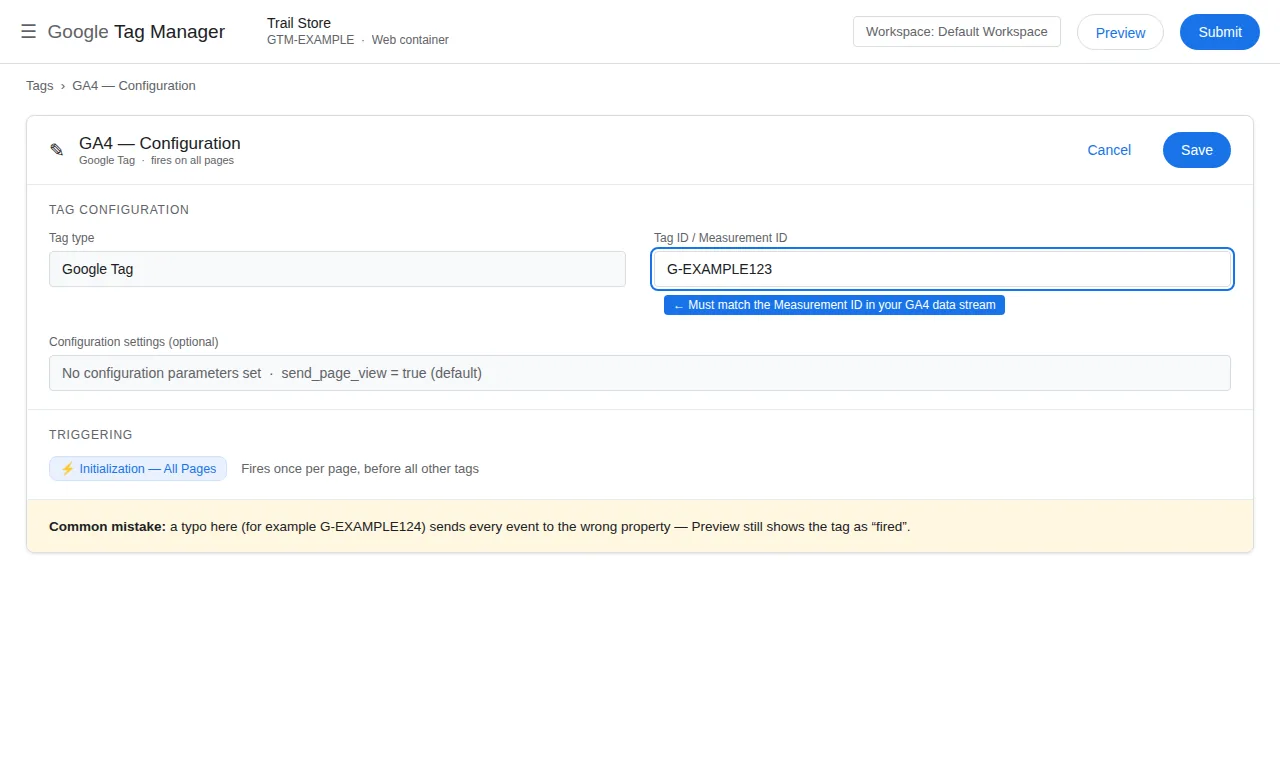
Check 2: The container was never published
Symptom: Everything works perfectly in Preview and nothing works for real visitors.
Verify: Preview mode runs the unpublished draft, so a working preview proves only that the draft works. In GTM, look at the top of the workspace. If it says there are unpublished changes, or the live version number is older than the version you tested, that is your answer.
Fix: Click Submit, publish the version, then hard-refresh the live site and test as a normal visitor — not in Preview. Add a plain version name when you publish, such as ‘GA4 purchase fix.’ You will thank yourself when you need the version history later.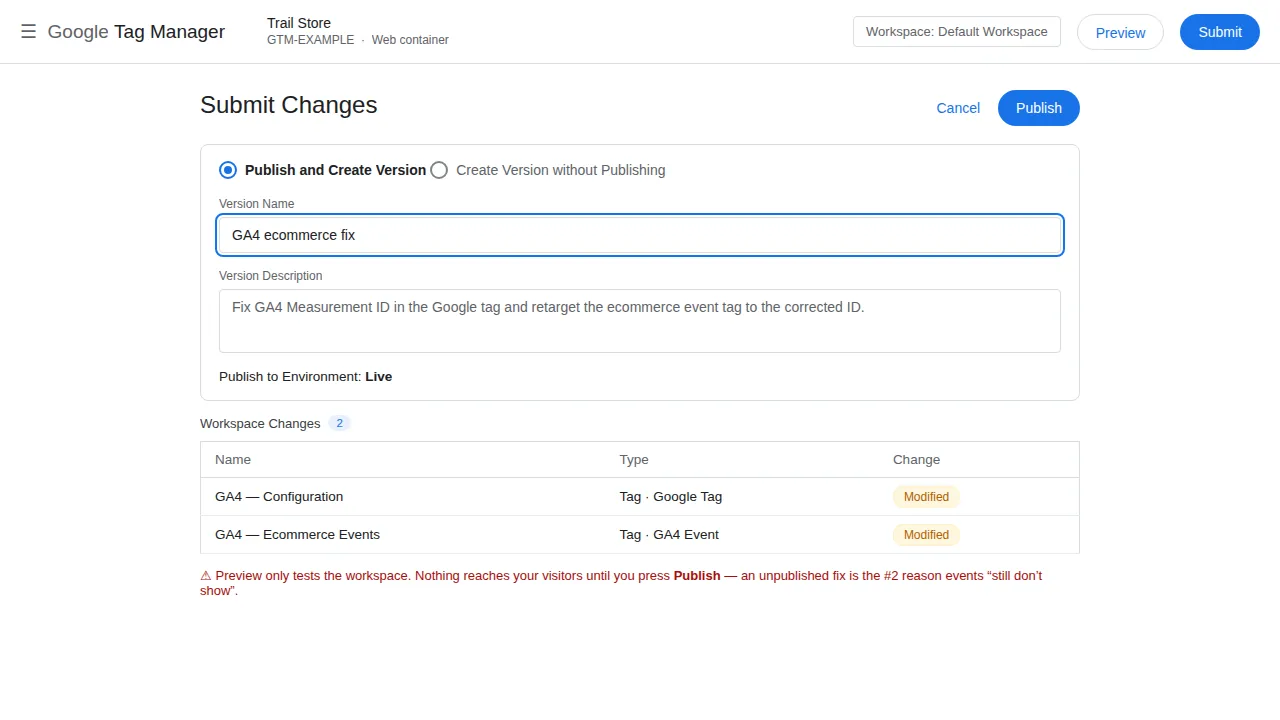
Check 3: You are testing the wrong container or environment
Symptom: A colleague cannot reproduce your result, or the live site behaves differently from your test site.
Verify: View the page source on the live site and search for GTM-. Compare that container ID with the one open in your GTM account. If you use environments for staging and production, check Admin > Environments and confirm the live site loads the Live environment snippet, not a staging one.
Fix: Install only the intended container on each environment. Two containers on one site also explains duplicate events, so remove any container left over from an old agency or a previous setup.
Check 4: Consent Mode v2 is blocking the hit
Symptom: Tags show as fired, or as ‘No tags fired,’ depending on the page, and GA4 receives nothing — especially from European traffic or after a cookie banner was installed.
Verify: In GTM Preview, open the Consent tab. Before you accept the banner, check the state of analytics_storage. If it is ‘Denied,’ Google tags will not send normal analytics hits. Then accept all cookies and repeat the action. If the event suddenly appears in DebugView, consent was the blocker. Also check whether your consent banner actually updates consent — a banner that hides itself without sending an update is a classic fault.
Fix: Set consent defaults before the Google tag fires, wire your consent management platform to send a consent update on accept/reject, and test both choices. Do not ‘fix’ this by forcing consent to granted. That breaks the point of Consent Mode and creates a compliance problem.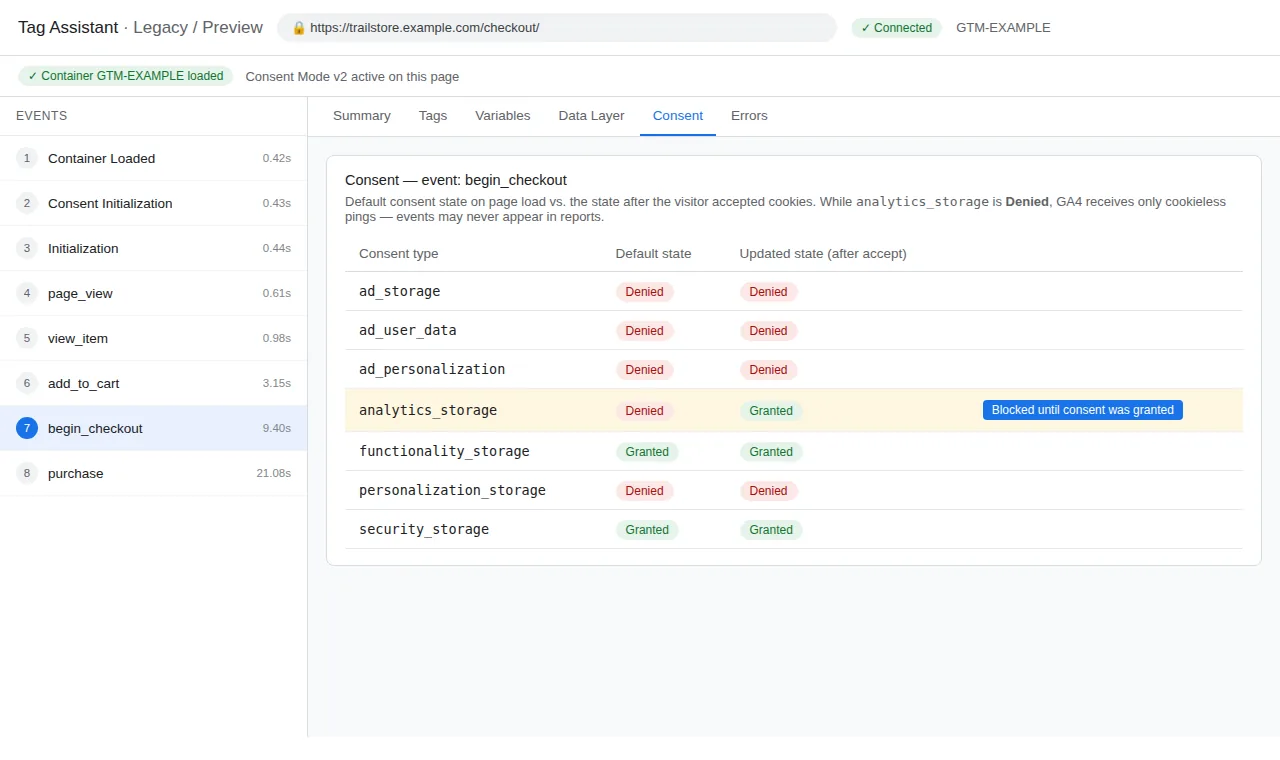
Check 5: A GA4 data filter is excluding you
Symptom: Other people’s events appear, but your own tests never do — even though DebugView or the Network tab shows a hit leaving the browser.
Verify: Go to GA4 > Admin > Data collection and modification > Data filters. Look for an internal traffic filter in ‘Active’ state, or a developer traffic filter. Internal filters permanently exclude traffic marked with the internal traffic type, which often includes your office, home, or VPN address if someone defined it that way.
Fix: For testing, leave filters in ‘Testing’ state until you understand their effect, define internal traffic carefully under Admin > Data streams > Configure tag settings > Define internal traffic, and never judge a setup only from a network that may be filtered out.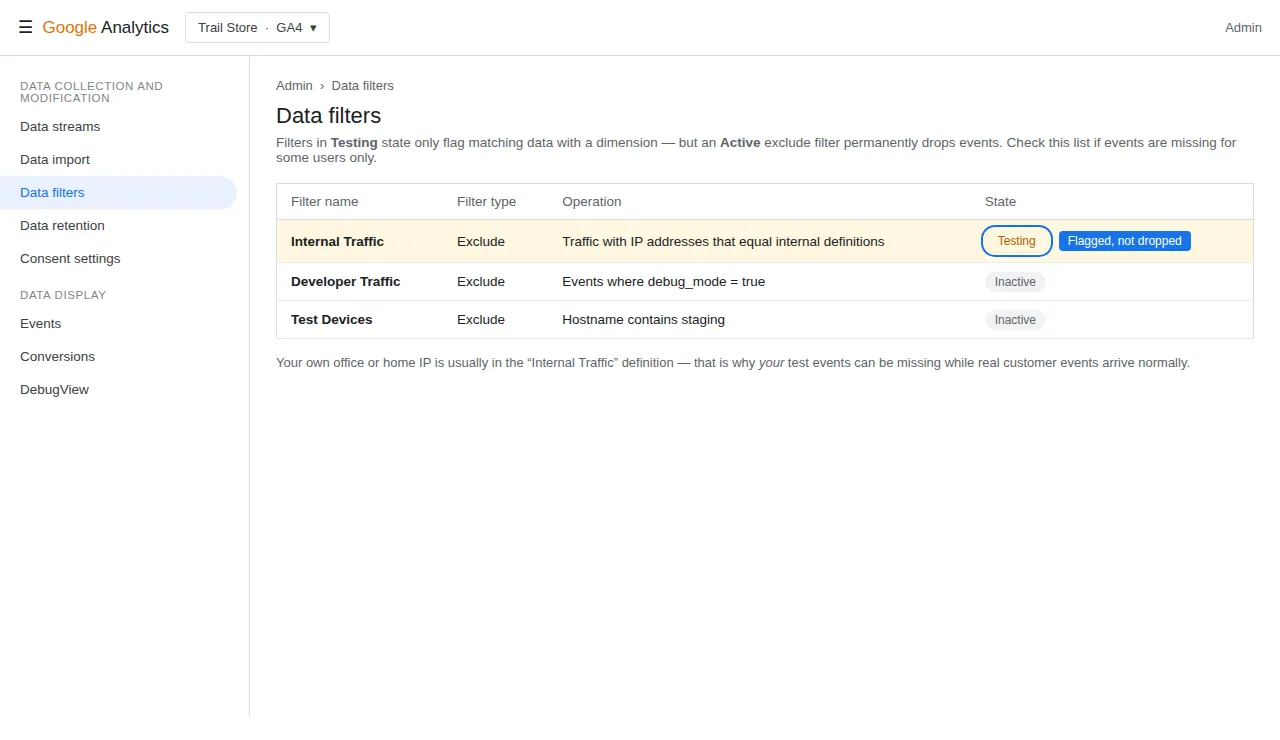
Check 6: You are looking in the wrong report, too soon
Symptom: DebugView shows the event, Realtime shows nothing, and the standard reports show nothing the same day.
Verify: Understand the three views. DebugView is for tagged debug traffic and is near real time. Realtime covers roughly the last 30 minutes and can lag. Standard reports are processed and can take 24 to 48 hours to finalise. An event visible in DebugView has reached GA4, even if a standard report is still empty.
Fix: Debug in this order: GTM Preview first, then GA4 DebugView, then Realtime, and only then standard reports the next day. Do not rebuild tags because a same-day standard report is empty.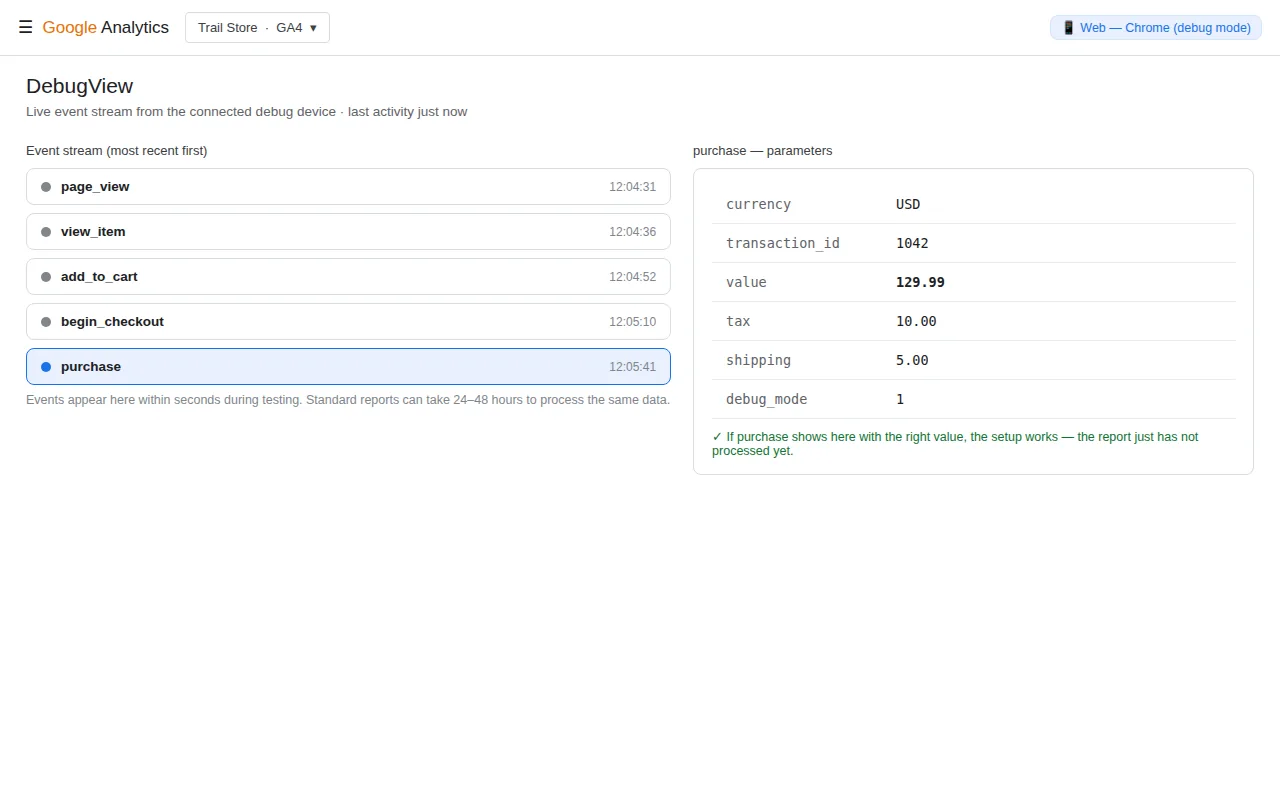
Check 7: An ad blocker or the browser stopped the request
Symptom: The tag fires in Preview for you in one browser, but not for colleagues, or not in a normal window.
Verify: Test in a clean Chrome profile with no extensions. Ad blockers, privacy extensions, Brave Shields, and some corporate networks block requests to Google Analytics endpoints even when GTM itself loads. Compare the clean profile with your usual profile.
Fix: You cannot control a visitor’s browser, and some loss is normal in analytics. Test in a clean profile so you do not chase a local blocking problem as if it were a site problem. If the loss matters commercially, that is when a properly consented server-side setup becomes worth considering — see our guide to server-side tracking for WooCommerce (https://www.tagmanagerbuilder.com/server-side-tracking-for-woocommerce/).
Check 8: Hardcoded gtag.js is running alongside GTM
Symptom: Page views or purchases are doubled, events appear that are not in your container, or GA4 behaves as if a second setup exists.
Verify: Search the page source for your Measurement ID and for gtag(. Then check your theme, a GA4 plugin, and Google’s Site Kit or a similar plugin. A common pattern is GTM installed correctly, plus an old direct gtag.js installation nobody removed.
Fix: Choose one route. If GTM manages your Google tag, remove the hardcoded gtag.js and any plugin setting that injects the same Measurement ID. Keep the setup in one place so firing rules stay visible.
Check 9: The event name or parameters are wrong
Symptom: Something reaches GA4, but it is a generic event, or the ecommerce report shows the event with no value, currency, or items.
Verify: In Preview, select the event in the left timeline and inspect the data layer and the fired tag’s payload. Check spelling and case exactly: GA4 expects names such as add_to_cart and purchase, not AddToCart or add-to-cart. For ecommerce, confirm the tag has ‘Send ecommerce data’ enabled with the data layer as the source, and that value, currency, and items (with item_id or item_name) are actually present.
Fix: Correct the data layer variable path first, then the tag. Do not add manual parameters to hide a broken data layer — fix the source so every platform receives the same clean data.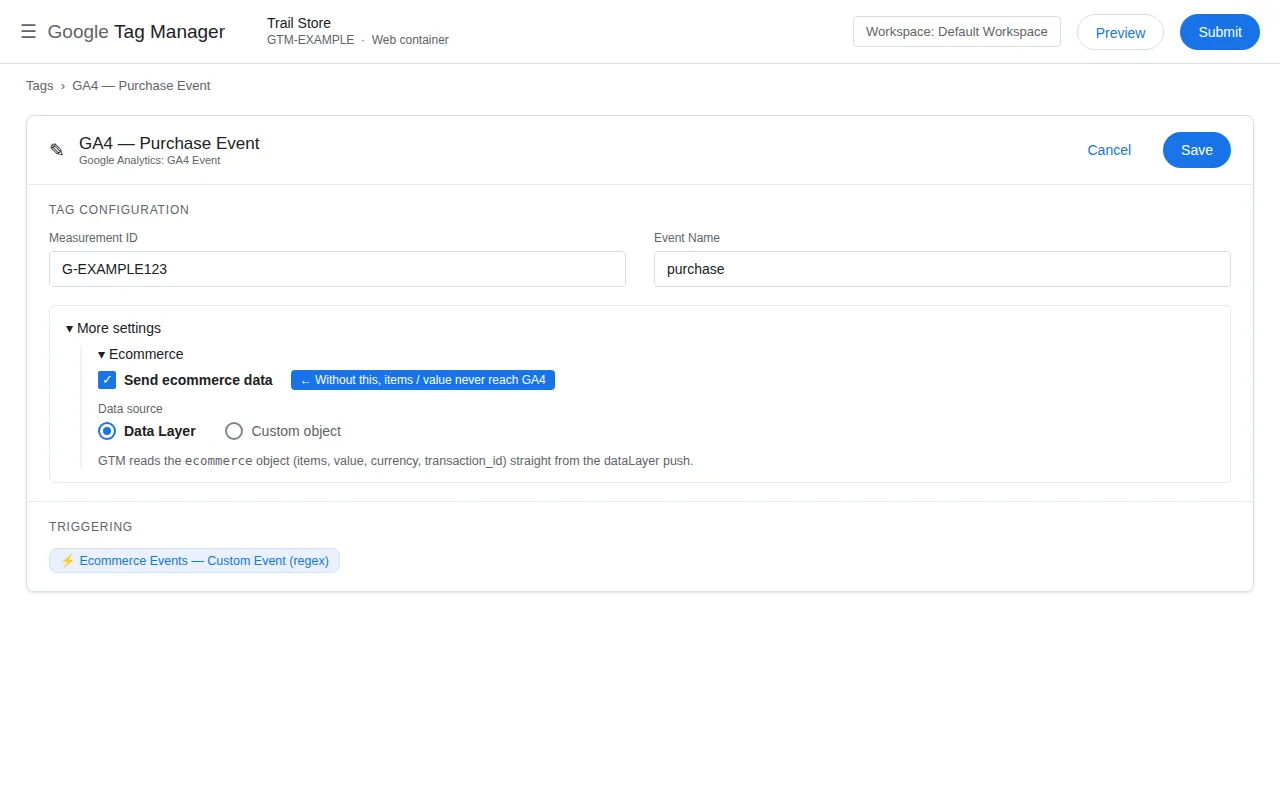
Check 10: The trigger fires before the Google tag is ready
Symptom: The first event on a page is missing or empty, while later events on the same page work.
Verify: In Preview’s timeline, check the order. If a custom event is pushed very early — for example in the page head — an event tag can fire before the Google tag has initialised, or before the values it needs have been set.
Fix: Fire the Google tag on initialisation on all pages, and push custom events only after the required values exist. On thank-you pages, push when the order is confirmed, not on a click that can happen before payment succeeds.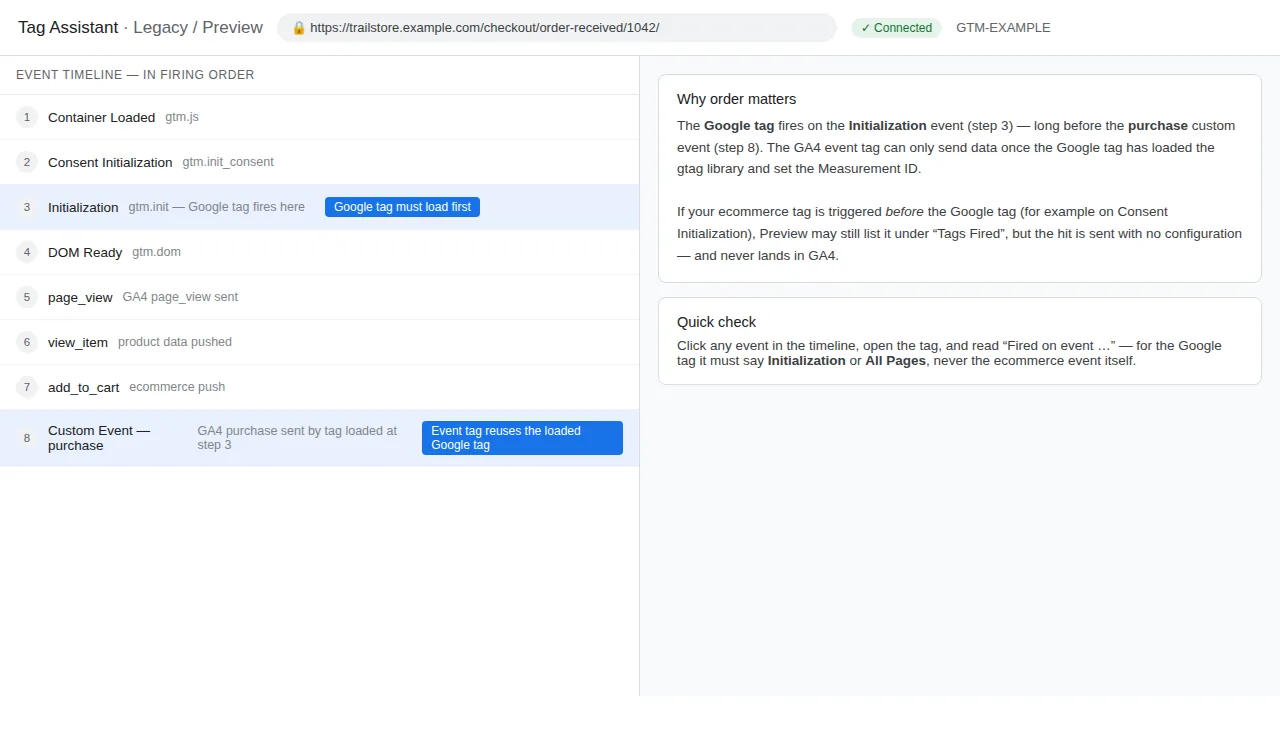
Check 11: Thresholds and low volume are hiding the data
Symptom: DebugView shows the event, but a standard report shows a threshold warning, missing rows, or ‘(not set)’ on a low-traffic site.
Verify: Look for the orange threshold icon in the report. When Google Signals is enabled and volume is low, GA4 can withhold rows to protect privacy. That looks like missing tracking, but the data was collected.
Fix: Widen the date range, use DebugView as proof of collection, and in Admin > Data display > Data identity consider whether ‘Device-based’ reporting suits a low-volume property better. Do not change tags to solve a reporting threshold.
Check 12: Check the Network tab for the actual request
Symptom: You still cannot tell whether the browser sent anything at all.
Verify: Open Chrome DevTools > Network, filter for collect, and repeat the action. A GA4 hit appears as a request to google-analytics.com/g/collect with your Measurement ID (tid) and event name (en) in the payload. Status 200 means Google’s collection endpoint accepted it. No request at all means the problem is before collection — tag, consent, or blocking. A request in Preview but not live points back to publishing or environment.
Fix: Return to the exact check above instead of guessing. This test separates ‘GTM did not send it’ from ‘GA4 did not show it’ — completely different problems.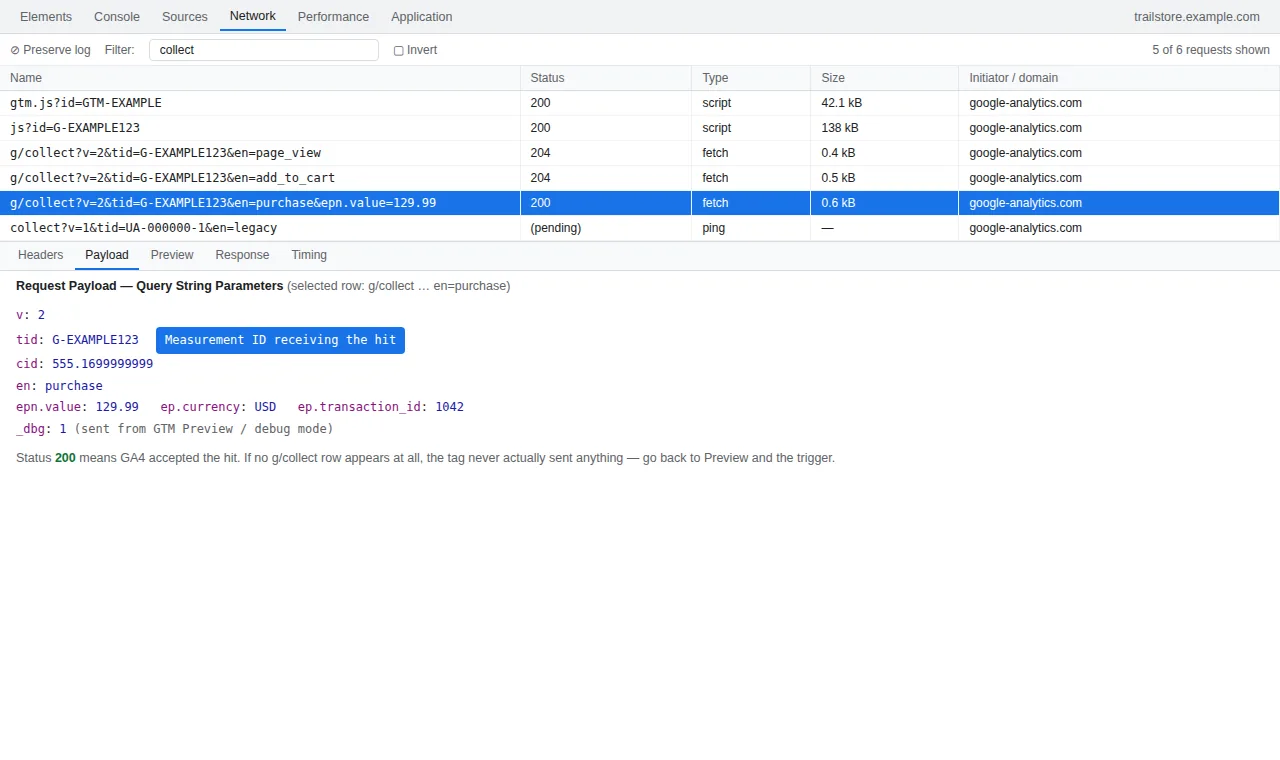
Summary checklist
| # | Check | Pass means |
|---|---|---|
| 1 | Measurement ID | GTM and GA4 stream IDs match exactly |
| 2 | Published | Live version contains your tested change |
| 3 | Container/environment | Live site loads the correct GTM container |
| 4 | Consent | analytics_storage updates correctly on accept |
| 5 | Data filters | Your test traffic is not actively excluded |
| 6 | Report timing | You checked DebugView before standard reports |
| 7 | Blocking | Event works in a clean browser profile |
| 8 | Duplicates | No hardcoded gtag.js beside GTM |
| 9 | Event/parameters | Name, value, currency, items are correct |
| 10 | Timing | Google tag initialises before the event |
| 11 | Thresholds | Low volume is not hiding collected rows |
| 12 | Network | A g/collect request returns 200 |
If you would rather skip the manual wiring, our free GTM container builder (https://www.tagmanagerbuilder.com/gtm-container-builder/) generates GA4, Meta and Google Ads tags with triggers and variables already connected, and the GTM setup guides (https://www.tagmanagerbuilder.com/gtm-setup/) explain how each event is built. Still publish and test it — an unpublished container helps nobody.
Frequently asked questions
Why does my tag fire in GTM Preview but not on the live site?
The usual reason is that Preview runs your unpublished draft. Publish the container version, clear any cache, and test again as a normal visitor.
How long should I wait before deciding an event is missing from GA4?
Check DebugView within minutes. Realtime can lag, and standard reports can take 24 to 48 hours to process fully, so do not judge a setup from a same-day standard report.
Can Consent Mode stop events reaching GA4?
Yes. If analytics_storage is denied and no consent update is sent when a visitor accepts, Google tags will not send normal analytics hits. Test the Consent tab in Preview with both reject and accept.
Why is my event in DebugView but not in Realtime?
They are different views with different delays and filters. DebugView proves the hit reached GA4. Realtime delays, data filters, and thresholds can each hide it there temporarily.
What does a 200 status on a g/collect request prove?
It proves the browser sent the hit and Google’s collection endpoint accepted it. If reports are still empty, the issue is downstream — filters, thresholds, timing, or the wrong property — not the tag firing.
Can having both gtag.js and GTM cause missing events?
It more often causes duplicates than missing events, but the conflict also makes debugging unreliable because you cannot tell which setup sent what. Keep one installation route.